
Your machines are running,
operators are busy, parts are coming off the line.
But does this activity truly reflect efficient production?
In this article, we examine Overall Equipment Effectiveness (OEE),
a metric that provides an objective assessment of manufacturing efficiency. We'll explore why OEE data is critical before making investment decisions, how it’s measured, and what challenges typically arise in real-world environments.
When developing strategies to improve manufacturing processes, having a measurable indicator of productivity is essential. OEE is among the most widely accepted metrics, representing—by percentage—how effectively and efficiently a machine or process is operating. A 100% OEE score signifies uninterrupted, maximum-speed, error-free production. When planning new equipment investments, OEE can help validate whether those decisions are justified.
Measure your current OEE before investing in new machinery. Hidden capacity often exists within your existing equipment.
Measuring Equipment Efficiency Accurately
The primary goal in manufacturing is to maximize the use of existing capacity and boost productivity through smart investments. However, many manufacturers move forward without thoroughly analyzing either capacity utilization or investment decisions. Companies that fail to accurately measure OEE may not recognize inefficiencies in their current operations and turn prematurely to new machinery as the solution.
In reality, there are multiple ways to increase capacity, each with different implications for budget, floor space, and organizational structure. That’s why it’s critical to evaluate the efficiency of existing equipment before pursuing additional capacity.
Let’s say your facility operates a line of 10 CNC machines and you're aiming to increase output. You have several options. First, you might add another shift, which requires additional staff and operational restructuring. Second, you could expand the production area and purchase more machines—an expensive path that further tightens floor space. The third option is to invest in robotic systems, which offer a much more cost-effective alternative to buying a new CNC.
In this article, before diving into robotic automation, we’ll walk through how to calculate OEE for CNC machines operated manually.

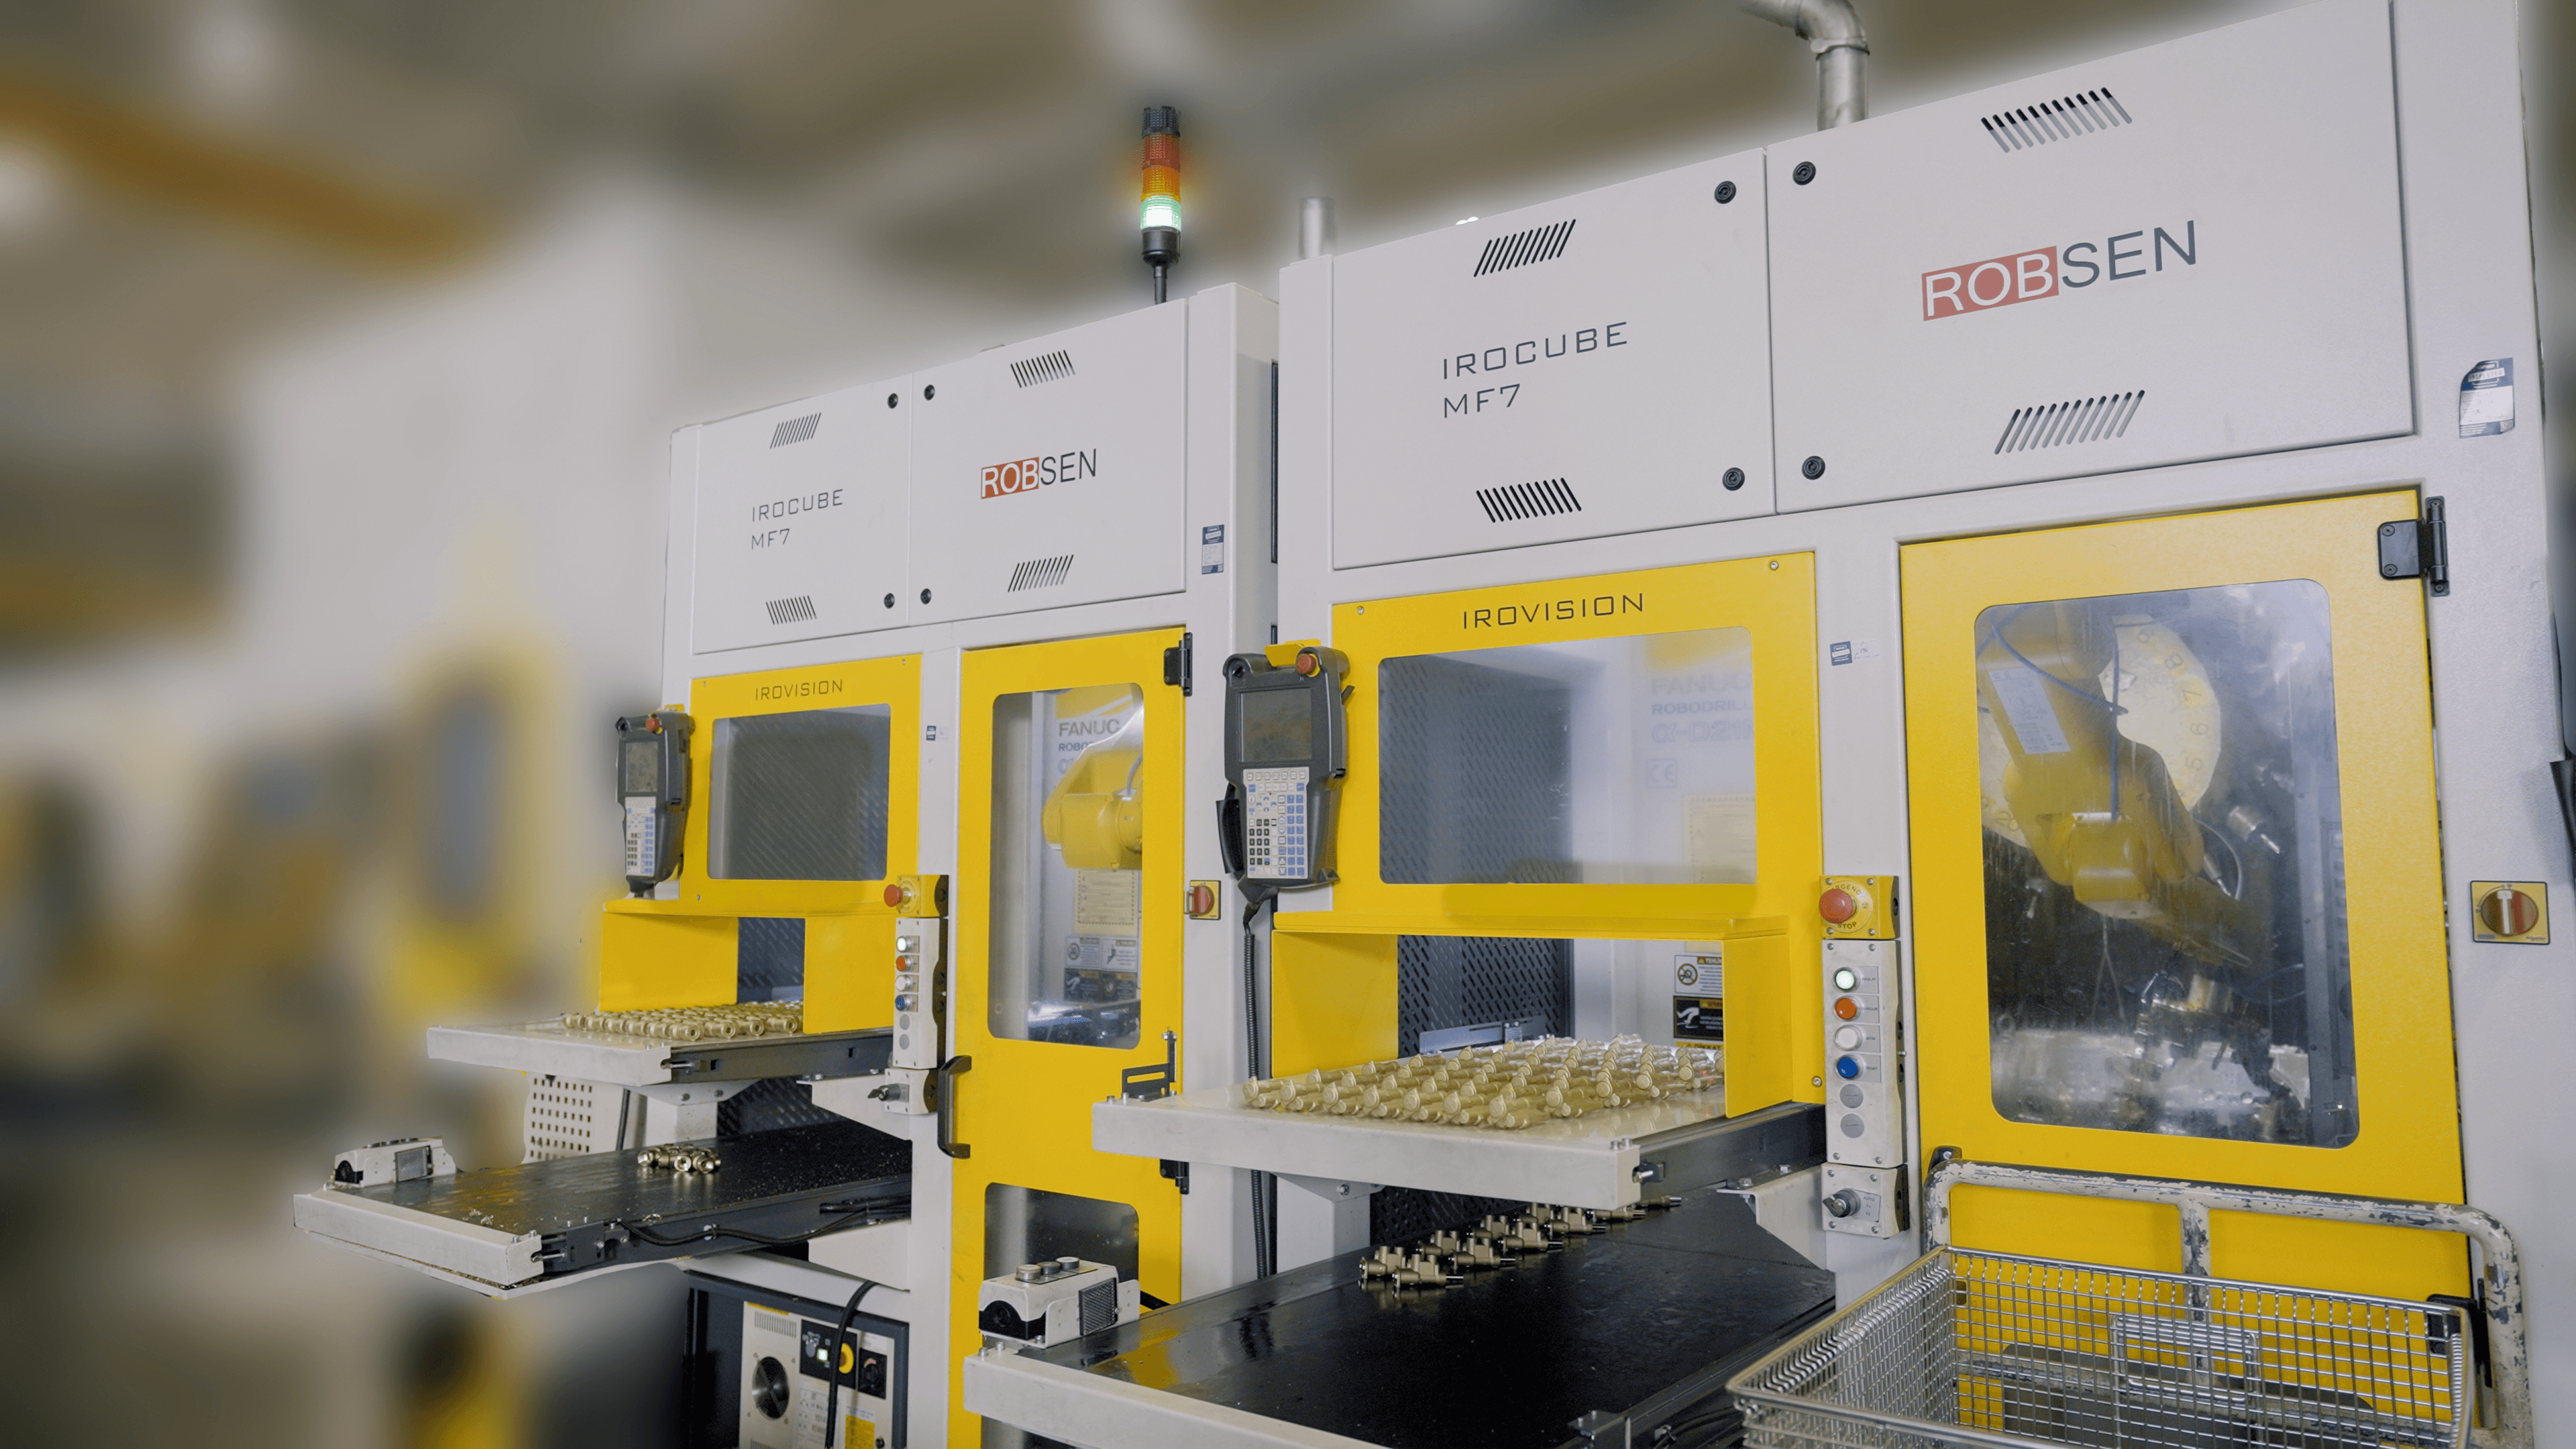
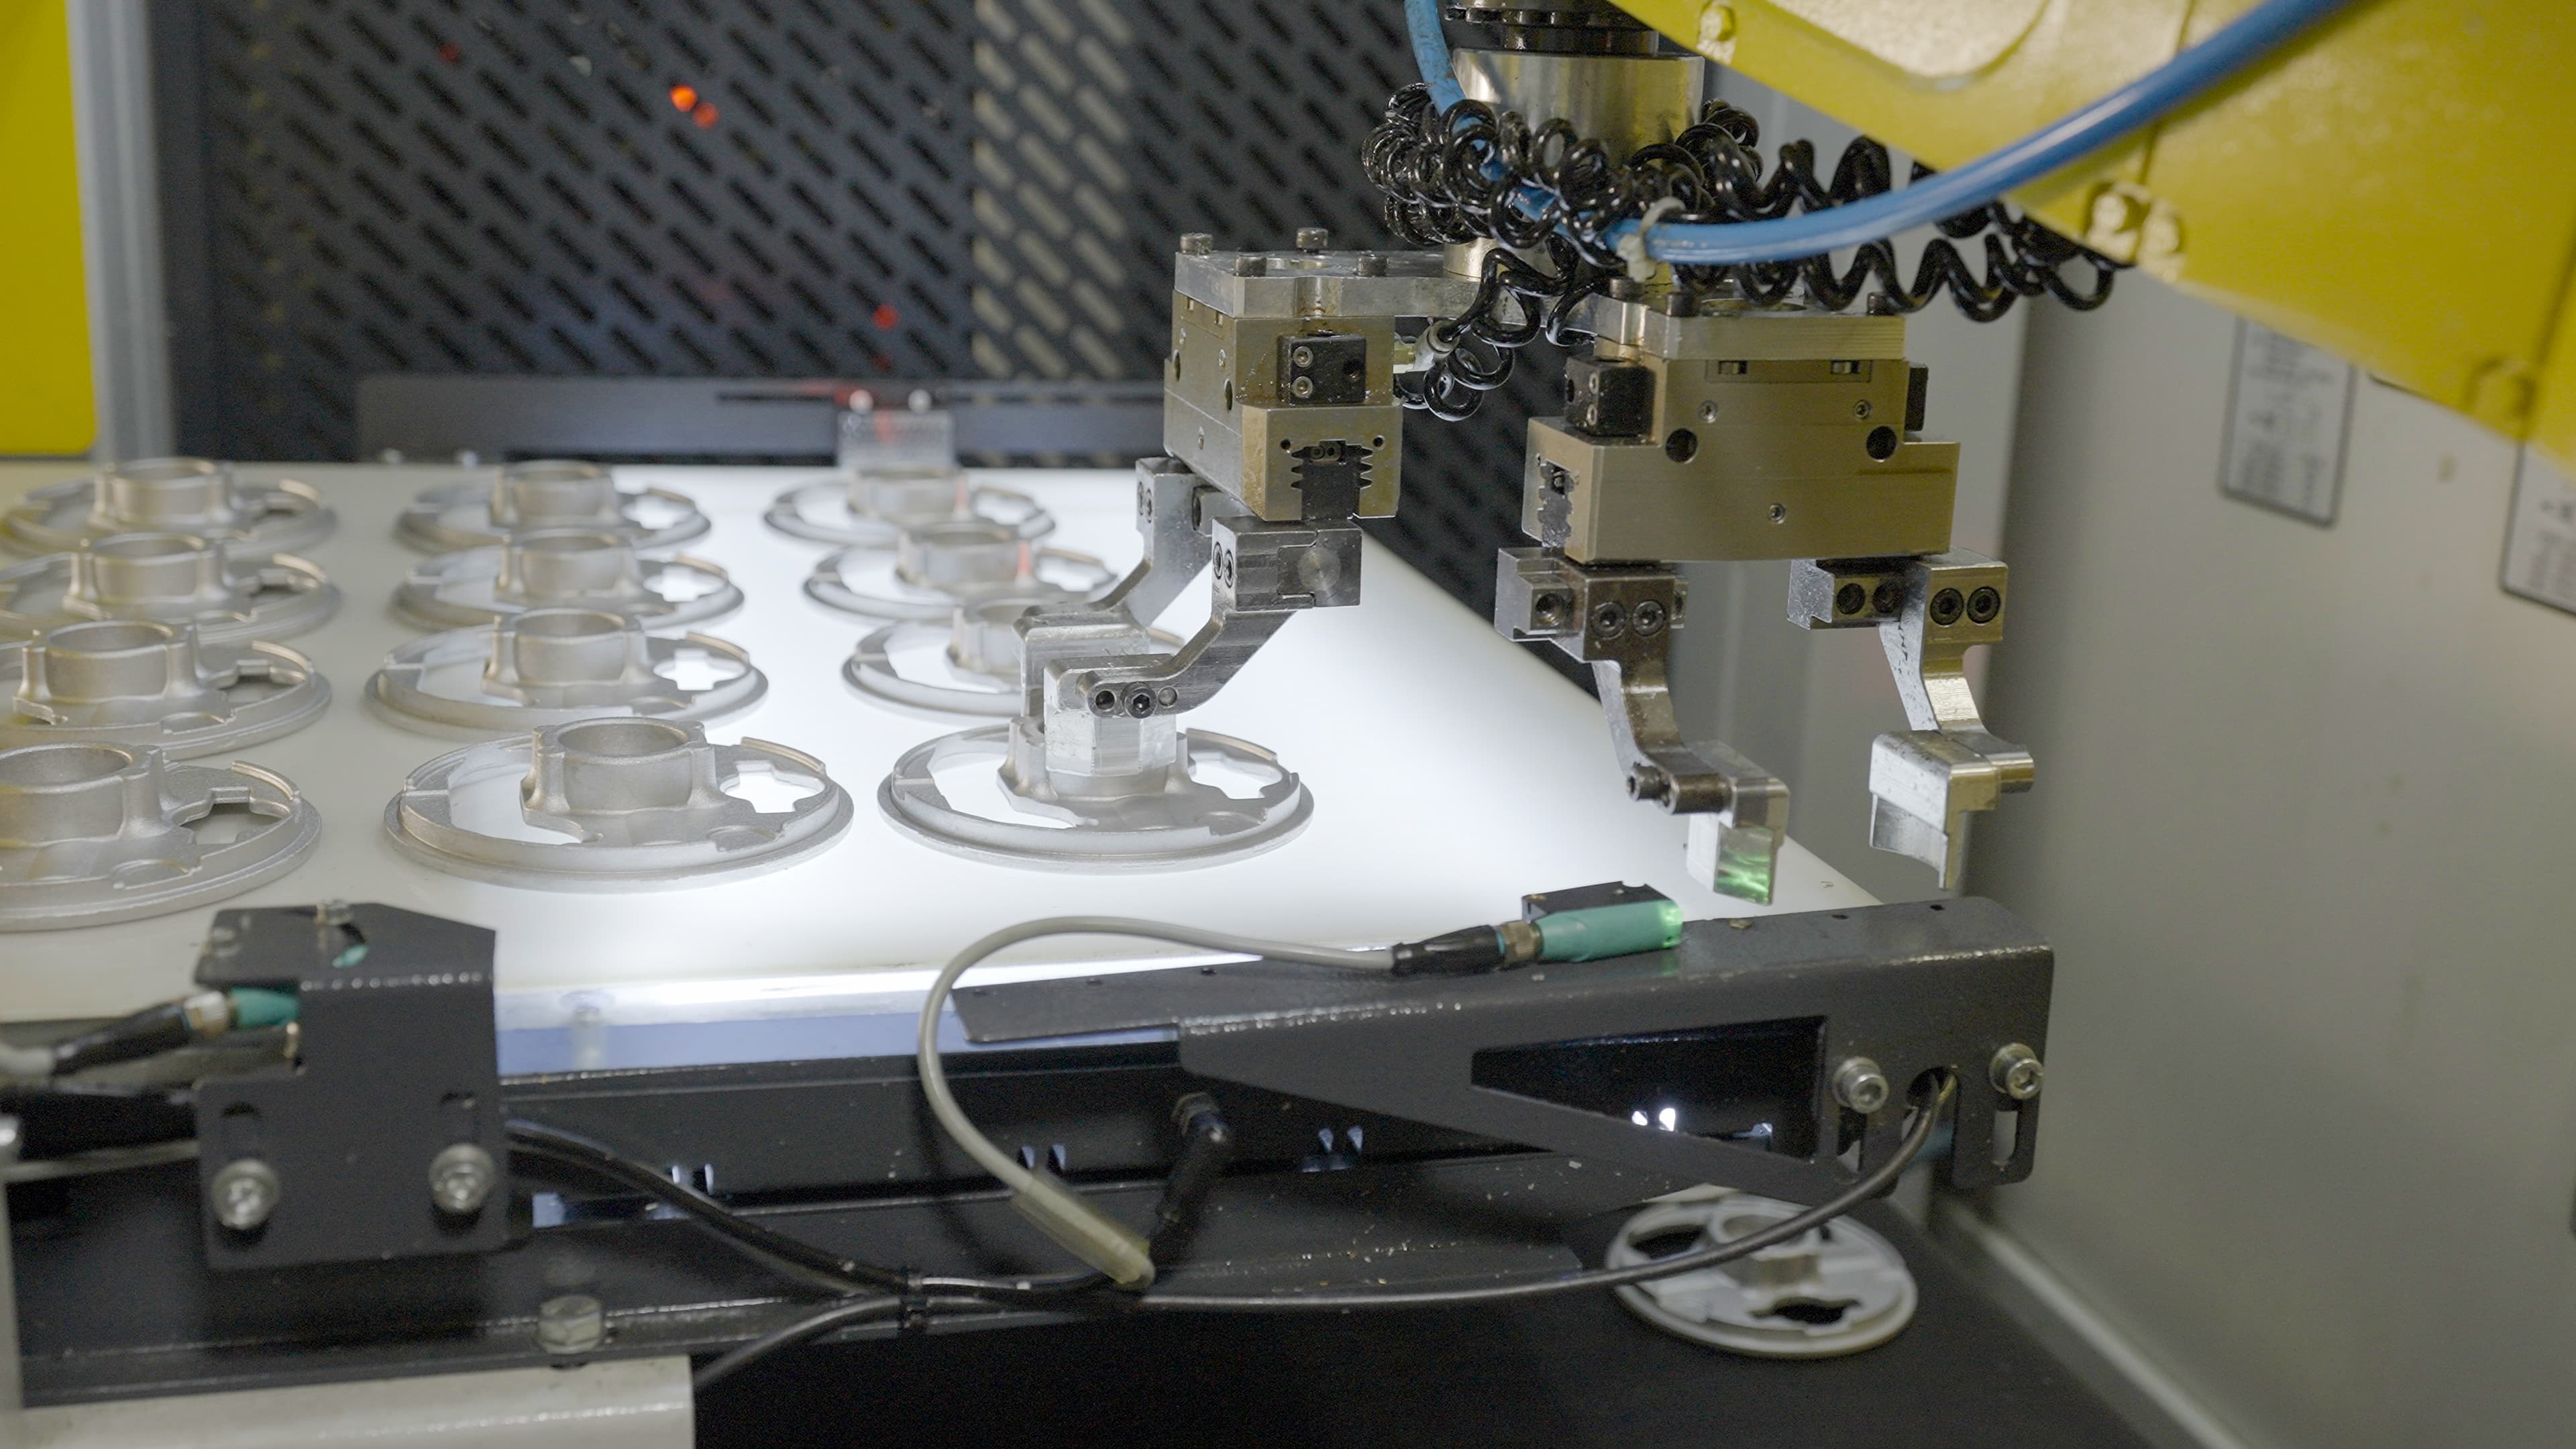
Figure 1. FANUC Robot picking machined parts using IROVISION vision guidance.
Reliable OEE Data Requires Time
To achieve accurate OEE insights, data must be collected consistently over several months. Announcing the measurement effort too soon can lead to short-term behavioral changes and artificial discipline on the floor—outcomes that skew the data and fail to reflect everyday realities.
To illustrate, let’s work through a sample OEE calculation based on a CNC machine fed manually. We’ll examine all three core metrics; Availability, Performance, and Quality. Step by step.
- Availability
Availability measures the portion of scheduled production time during which the machine is actually running. This is affected by events such as machine breakdowns, material shortages, tool changes, or scheduled maintenance.
In our scenario, one shift is 480 minutes long. Planned downtime includes 40 minutes for lunch, 20 minutes for breaks, and 10 minutes for cleaning, maintenance, and shift change, totaling 70 minutes. That leaves 410 minutes of scheduled production time.
Unplanned downtime due to material delays, quality issues, tool changes (25 minutes), and spare part shortages or undefined stoppages (30 minutes) adds up to 55 minutes.
Thus, the machine is effectively running for 355 minutes.
Availability (%) = 355 / 410 = 86.6%
Even before considering performance and quality losses, planned and
unplanned downtime reduced available production time by over 13% in this example.
- Performance
Performance evaluates how close the machine’s actual cycle time is to its ideal cycle time during periods of operation. Slow cycles and brief, unrecorded stops reduce performance. A 100% score means the machine ran at maximum theoretical speed.
In our example, under ideal conditions—including both machining time and part handling—a CNC machine could theoretically produce 180 parts per shift. However, the 6-month average shows only 135 parts are produced.
Why? Often, one operator feeds multiple machines manually. When synchronization fails, machines wait for the next part. These delays and similar inefficiencies result in lower output.
Performance (%) = 135 / 180 = 75%
Low performance doesn't always indicate a machine problem.
It often results from operator waiting time, synchronization issues, and manual handling.
- Quality
Quality reflects the proportion of parts that are produced correctly the first time—meeting standards without requiring rework or being scrapped. It is calculated as the ratio of good parts to total parts produced.
In this scenario, the average output per shift is 135 parts. Data from the last six months indicates that 125 of these met quality standards. The remaining 10 parts were scrapped due to issues such as improper loading, tool wear, or operator error.
Quality (%) = 125 / 135 = 92.6%
Final OEE Score
The Overall Equipment Effectiveness is calculated by multiplying the three ratios:
OEE = Availability × Performance × Quality
OEE = 86.6% × 75% × 92.6% ≈ 60%
An OEE of 60% doesn't necessarily mean you need another CNC machine.
It often means you haven't fully utilized the equipment you already own.
You may feel that this score is unreasonably low. But for manually operated CNC machines, an OEE of around 60% is quite realistic in many facilities across the country.
To understand how a robotic feeding system could improve this score, we recommend reading the next article in this series.
Key Takeaways:
1. OEE reveals hidden capacity.
2. Measure before investing.
3. Automation improves OEE dramatically.